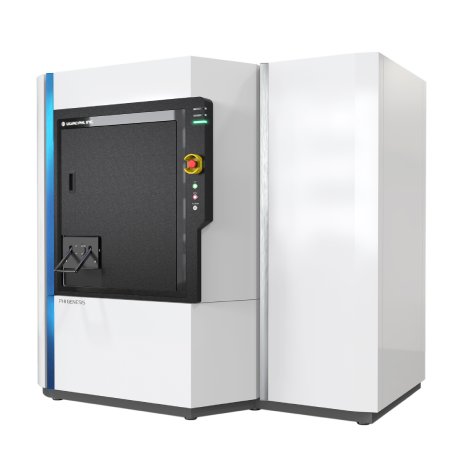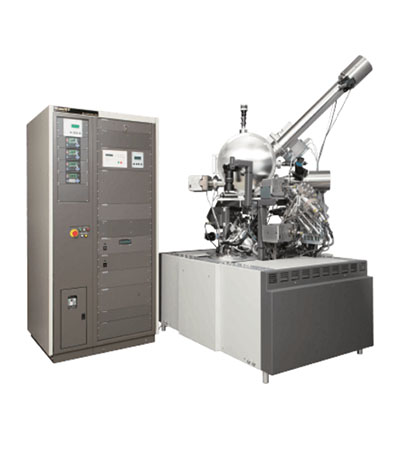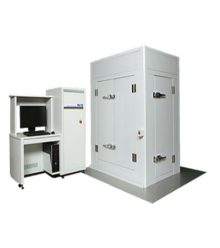
PHI nanoTOF II Time-of-Flight SIMS

PHI nanoTOF II Time-of-Flight SIMS

  • TRIFT mass analyzer
  • 30 kV LMIG with Bi, Au, or Ga emitter
  • Dual beam charge neutralization
  • 5 axis sample stage
  • In-situ optical viewing
  • Secondary electron detector
  • WinCadence instrument control and data reduction software package
  • Analysis chamber with four primary ion gun ports
  • 350 l/s turbo molecular pump
  • Integrated bakeout facilities
  • MS/MS ready spectromoter


Description


 PHI’s patented TRIFT mass spectrometer provides superior sensitivity, low spectral background, and the unique ability to image highly topographic surfaces. The nanoTOF II can be configured with a wide variety of options to optimize performance for organic materials, inorganic materials, or both, depending on customer requirements. The newest option for the nanoTOF II, Parallel Imaging MS/MS, allows secondary ions of choice to be extracted from the TOF-SIMS data stream for fragmentation and analysis in a separate TOF analyzer.  This provides for unambiguous peak identification and paralleltandem MS imaging capability.
  • Superior TRIFT Analyzer Performance
  • HR²
  • Parallel Imaging MS/MS – NEW!
  • Cluster Source Ion Guns
  • FIB-TOF 3D Chemical Imaging
  • Features & Accessories


Superior TRIFT Analyzer Performance

Uniform imaging sensitivity on curved or rough surfaces due to the large solid angle of collection

Superior depth-of-field for high mass resolution images due to large energy acceptance window

Low spectral background and highest abundance sensitivity due to the ability to reject metastable ions

High mass sensitivity for organic and medical applications

Turnkey insulator analysis enabled by patented dual beam charge compensation technology

MS/MS ready spectrometer for unambiguous peak identification


 Superiro Thrift Analyzer Displayal

HR²

High spatial resolution with high mass resolution

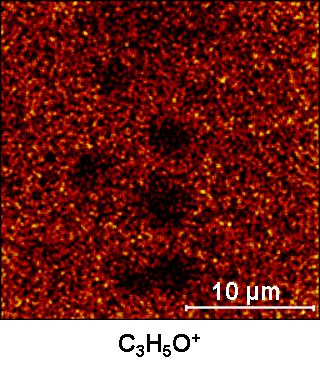
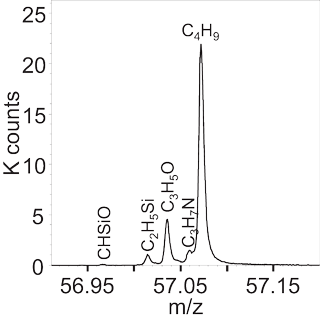
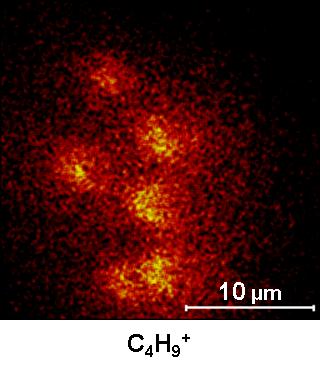
HR² imaging is demonstrated below in the images of micro-organic droplets. In a single analysis, peaks for multiple molecular fragments were observed in the spectrum at m/z 57 with high mass resolution and identified by measurement of their exact mass. The distribution of each species was visualized with a spatial resolution of less than 400 nm. The single measurement that contains all this information was acquired in only six minutes due to the high ion beam current available in the nanoTOF’s HR² imaging mode.


HR2 Imaging

M/Z Graph


HR2 Imaging

Parallel Imaging MS/MS – NEW!

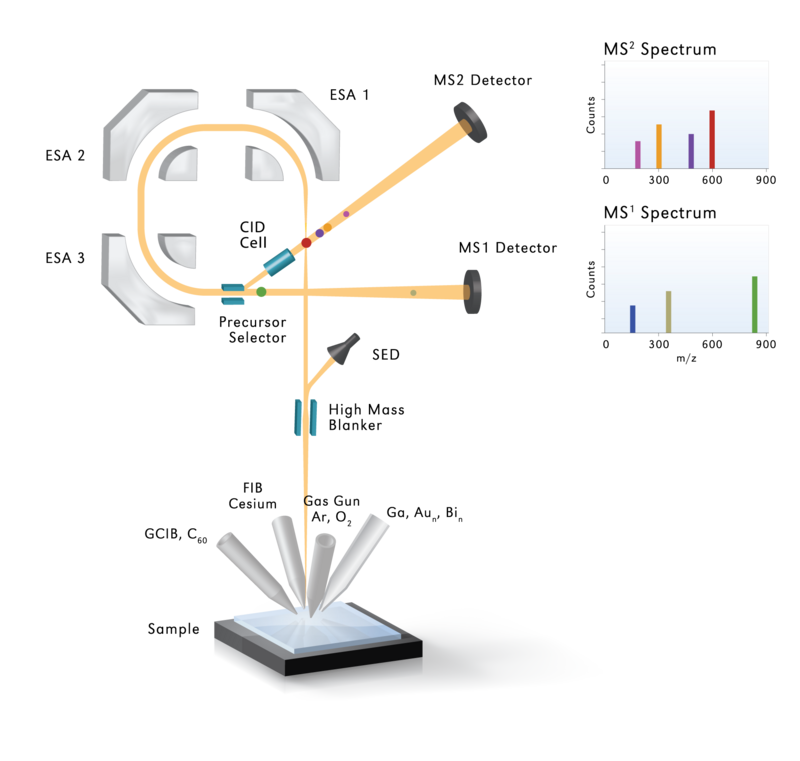
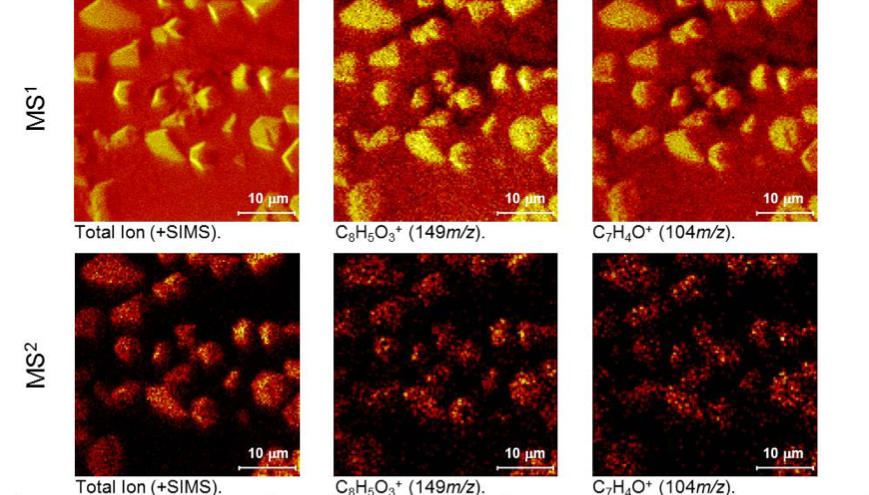
Due to the limitations of TOF-SIMS in mass accuracy and mass resolution, high mass peaks often go unidentified in traditional TOF-SIMS experiments.  PHI’s new revolutionary Parallel Imaging MS/MS option eliminates this limitation.  In the MS/MS mode, a precursor ion of choice (1 Dalton wide nanoisotopic acceptance window) is selected from the secondary ion stream and deflected into a high energy collision induced dissociation (CID) cell while the rest of the secondary ions are collected as usual (MS1 data).   In the CID cell, the precursor ions collide with argon gas causing fragmentation.  The resulting fragment ions are mass separated in a linear TOF and counted at a second pulse counting detector, producing an MS/MS spectrum (MS2).   Similar to the MS1 data, a full spectrum is collected for each image pixel in the MS/MS experiment.  Thus, the MS/MS tand traditional TOF-SIMS data are collected simultaneously from the same analytical area in a single experiment.  The imaging speed of both MS1 and MS2 data is based on a pulsed ion beam operated at >8 kHz.

The resulting MS/MS fragmentation spectrum is used to positively identify the composition of the precursor ion by identification of the fragmented ions and/or comparison to mass spectral databases.  Operating the TOF-SIMS in the MS/MS mode can also improve the sensitivity for species in which the peak of interest has mass interferences with other compounds.  By detection of a unique fragment ion originating from the species of interest, the limit of detection can be greatly improved.

HR2 Imaging

Parallel imaging of MS1 and MS2 peaks from a sample of heat treated PET, showing that identical areas are analyzed at the two detectors and that the precursor molecule at +m/z 577 (ethylene terephthalate trimer) is localized to the crystals.   Line scans show <200 nm spatial resolution for both modes of imaging.  MS1 and MS2 data are collected in parallel at 8 kHz in less than 15 minutes.

Line Scan

Heat treated PET sample.  Composition assignments for the MS2 spec.  trum obtained from CID fragmentation of the +mass 577 precursor ion confirm that the observed crystals are composed of ethylene terephthalate trimer

Heated Treated PET Sample

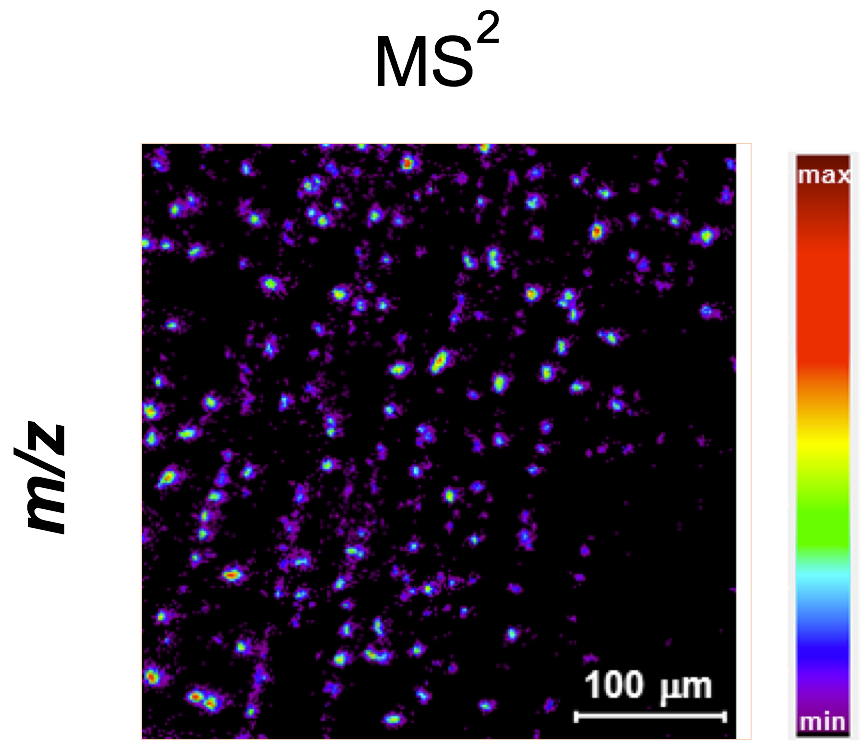
Automotive polymer sample.   MS/MS image (MS2) of the +m/z 481 precursor ion showing a non-uniform distribution of the species on the sample surface.

MS2 Spectrum Loss Scale

MS/MS spectrum (MS2) obtained from CID fragmentation of the +m/z 481 precursor ion.  Identification of the fragment ions indicates that the precursor ion [M+H]+ is Tinuvin 770, a polymer additive.

MS2 Spectrum Loss Scale

Further confirmation of the identity of the precursor ion is made with a positive match to Tinuvin 770 in a commercially available MS/MS database which is included with the MS/MS option.  The spectrum in red is the MS2 spectrum and the blue spectrum is the acquired reference database spectrum of Tinuvin.

Cluster Source Ion Guns

Multiple cluster source ion gun options

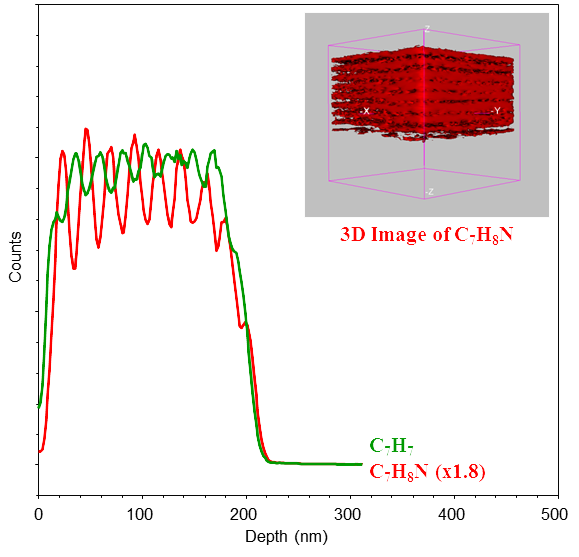
Depth profile of a multi-layer polystrene and ply block

Fig A: 20 kV Ar2500+ gas cluster ion beam


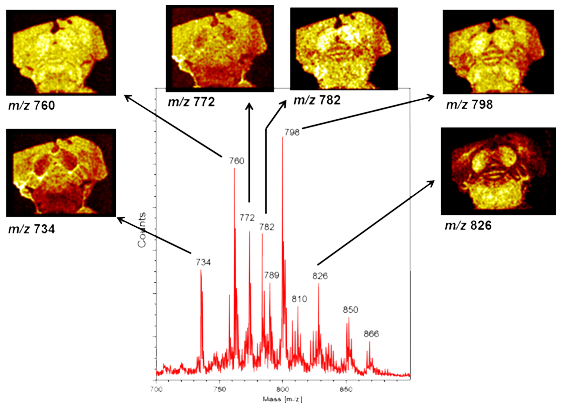
Detection and imaging of specific lipids in a mouse brain specimen

Fig B: 20 kV C60 ion gun

20 kV Ar2500+ gas cluster ion beam for molecular depth profiling organic films. Shown in Fig. A is a depth profile of a multi-layer polystyrene and poly (2-vinylpyridine) block copolymer film obtained by sputtering with a 5 kV Ar2500+ gas cluster ion beam.


20 kV C60 ion gun provides imaging and spectroscopy when the highest sensitivity for organic species is required. Shown in Fig. B is the detection and imaging of specific lipids in a mouse brain specimen.


FIB-TOF 3D Chemical Imaging

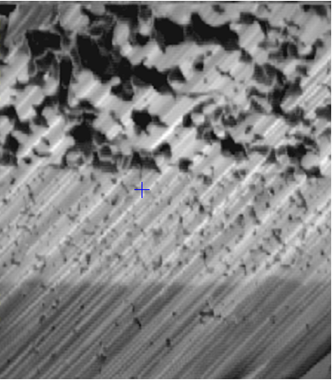
SED image of FIB cut

SED Image of FIB Cut

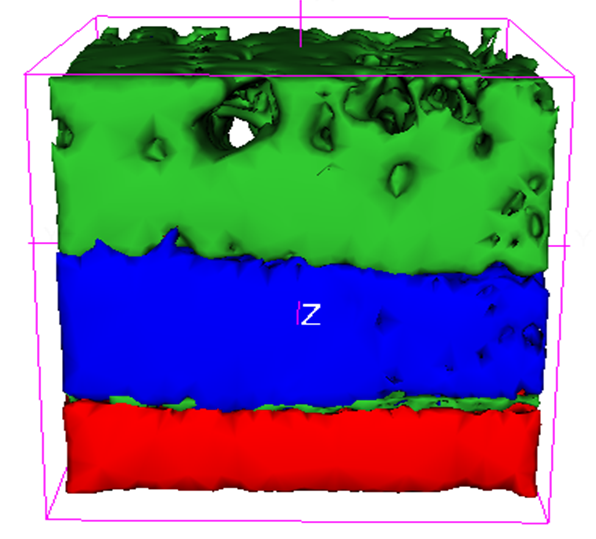
3D Image

Overlay of Sr+, Ce+, Zr+ 3D Images

  • TOF-SIMS imaging of FIB sectioned specimens
  • High mass resolution spectra at every pixel
  • 3D imaging software with multi-element overlay capability


Features & Accessories

Standard Features

  • TRIFT mass analyzer
  • 30 kV LMIG with Bi, Au, or Ga emitter
  • Dual beam charge neutralization
  • 5 axis sample stage
  • In-situ optical viewing
  • Secondary electron detector
  • WinCadence instrument control and data reduction software package
  • Analysis chamber with four primary ion gun ports
  • 350 l/s turbo molecular pump
  • Integrated bakeout facilities
  • MS/MS ready spectromoter


 Optional Accessories

  • MS/MS analyzer and electronics package
  • 20 kV C60 pulsed ion gun
  • 20 kV Ar2500+ gas cluster ion gun
  • 2 kV Cs ion gun
  • 5 kV gas gun (Ar/O2)
  • Oxygen flood module
  • 30 kV Ga FIB gun
  • Hot/Cold sample stage module
  • Flash cooling for sample intro chamber
  • High temperature sample stage module
  • Sample transfer vessel
  • Intro chamber glove box
  • Voltage cycling sample stage module
  • Sample preparation chamber