Discount Products: Look through products available for a 25% – 50% discount in 2020. The items provided on a first come, first serve basis. View Discounted Products
Viscometer-Rheometer-on-a-Chip (VROC®) combines microfluidic and MEMS (Micro-Electro-Mechanical Systems) technologies.
The Superior Viscometer
Compared to conventional viscometers and rheometers, microfluidic devices offer several advantages. They:
Require small sample volumes of liquid
Impose high shear rates without encountering flow stability
Maintain complete enclosure of fluid to prevent evaporation
Can be used as simple flow-through device
More Accurate Viscosity Measurements
Products built on our technology platform completely characterize flow, helping you achieve cost-effective flow and material characterization. Complete viscosity characterization is essential in the production of complex liquids with non-Newtonian viscosity characteristics.
Our technology quantifies true flow properties, whereas many existing products only qualitatively approximate apparent properties.
Why MEMS and Microfluidics for Viscosity?
Microfluidics deals with the behavior, precise control, and manipulation of small (microliter and nanoliter) volumes of liquids. Microfluidics enables high throughput analysis.
MEMS chips integrate mechanical elements, sensors, actuators, and electronics on a common silicon substrate, using microfabrication technology.
Through its hybrid microfluidics/MEMS technology, RheoSense has developed smaller, smarter, and faster micro-scale-sample viscometers, which can measure fluids’ viscosity in all types of environments.
Principle of RheoSense Viscometers
VROC® sensors read viscosity by measuring the pressure drop as a test liquid flows through its flow channel. This is a well-known application of rheometry principles (K. Walters, Rheometry, Chapman and Hall, London, 1975) and also listed in US Pharmacopeia.
As the test liquid is forced to flow through the sensor’s flow channel, the rheometer measures pressure at positions increasingly far from the inlet.
In this resulting (example) plot of measured pressure versus sensor position, the slope of the straight line is proportional to the viscosity.
Our Viscometer Implementation
To create a dynamic micro-sample viscometer, RheoSense took this principle and added microfludics, while reducing the device’s size. Our resulting VROC® technology offers capabilities well beyond the limits of conventional viscometers.
VROC® is capable of making measurements not possible with other instruments…the ability of the RheoSense viscometer to measure very small sample quantities is also useful. We have found the instrument to be accurate and reliable
With the apyron imaging system you will be prepared to explore beyond the established frontiers of your field. It has been developed to overcome the boundary between ease-of-use and ultimate capability in Raman Imaging. Equipped with this seamless versatility, your creativity can be fully expressed.
When simplicity meets performance
As a member of the WITec product family, apyron sets the benchmark for automated Raman Imaging systems with excellent imaging qualities: outstanding spectral and spatial resolution, ultra-fast acquisition times, and exceptional signal sensitivity in combination with automated system configurations and intuitive measurement procedures.
When high-resolution imaging meets high-resolution spectroscopy
Ultrahigh-throughput spectrometers provide unprecedented spectral resolution, detailed spectral information at every image pixel and the highest Raman signal sensitivity.
apyron is the ideal Raman imaging system for:
Multi-user labs accomodating varied user skills and requirements
Industry labs with recurring experimental scenarios and an emphasis on time-critical turnover
Raman newcomers with advanced imaging requirements
Leading Raman spectroscopists seeking the next performance benchmark
The new automated Raman Imaging system apyron
A New Class of Automated Raman Imaging Systems – Key Features
WITec is established as the manufacturer of the industry‘s most advanced Raman Imaging systems. This distinction now also extends to automated systems.
TruePower: Automated Absolute Laser Power Determination in mW
The absolute laser power is measured in the optical fiber and can be adjusted with accuracy of <0.1 mW. A laser shutter shields the sample from the laser light and opens only during Raman analysis with optimized laser power to avoid any sample degradation. apyron is the only Raman Imaging system on the market to provide such an accuracy ensuring optimal laser power for the preservation of delicate samples and reproducibility in measurement conditions.
Automated Laser Wavelength Selection and Spectrometer Adjustment
The selection of the laser has never been easier: With a simple click of the mouse the wavelength can be chosen in the software user interface. What follows is an automated adjustment and calibration of all spectrometer components such as filters, gratings etc. to enable optimal system performance.
Performance Facts:
More than 16 million Raman spectra can be acquired in a single dataset
Spectral resolution down to 0.1 rel. 1/cm per pixel (@633 nm excitation)
3D Raman Imaging at a lateral resolution limited only by physical law
Push-button instrument and measurement control
Ultrahigh-throughput Spectrometers for Unprecedented Spectral Resolution, Detailed Spectral Information at Every Image Pixel and the Highest Raman Signal Sensitivity
The lens-based imaging spectrometer was specifically designed for Raman microscopy and applications at ultra-low light intensities. Versions are available for a wide variety of excitation wavelengths and focal lengths and are optimized for their specific laser wavelength:
UHTS 300 for most effective and ultrafast 3D confocal Raman Imaging
UHTS 400 for excellent spectral and image quality for the red and NIR
UHTS 600 for unrivaled spectral resolution in 3D confocal Raman Imaging
Additional Features:
Automated sample positioning and motorized scan tables
Software-controlled measurement settings
TrueSignal: system-controlled adjustment of the optical fiber position to maximize the light into the fiber output of the microscope
TrueCal: convenient performance of pre-defined calibration routines for the optical and mechanical microscope components whenever required
Laser safety class 1
apyron: powerful data acquisition and post-processing
apyron Applications
Carbon Tetrachloride in an Alkane-Water-Oil Emulsion
Carbon Tetrachloride is quite often used as a reference sample in order to determine the performance of a Raman spectrometer in terms of spectral resolution. The characteristic peak at 460 rel. 1/cm should be clearly resolvable at room temperature. Due to its ultra-high optical throughput the apyron is the first system on the market to allow for FAST RAMAN IMAGINGTM while simultaneously maintaining the ability to resolve this peak.
3D confocal Raman image of the emulsion. Green: Alkane; Blue: Water; Yellow: CCl4 + Oil. (Image parameters: 200 x 200 x 20 pixels, 100 x 100 x 10 µm³ scan range, 0.06 s integration time per spectrum, 532 nm excitation wavelength.) Zoom-in image with high spectral resolution. (Image parameters: 100 x 100 pixels, 10 x 10 µm², 0.08 s integration time per spectrum, UHTS 600 spectrometer, 1800 g/mm grating.) Due to the high spectral resolution of the spectroscopic system the bands of the CCl4 peak at 460 cm-1 can be clearly resolved at room temperature.
White-light microscopy and color-coded Raman Image overlay of a squashed banana pulp sample
The Raman image was acquired with an apyron attached to the 600 mm focal length UHTS 600 spectrometer system (grating: 300 g/mm) to provide the highest spectral performance. Red: beta-Carotene-rich areas, Green: Starch, Blue: Water
Only the apyron is capable of generating Raman images along with the parameters as in the following: Excitation: 532 nm, Laser Power: 49.9 mW, Scan area: 400 x 300 µm², 1200 x 900 pixels, Integration time: 2 ms/spectrum/pixel
No other AFM matches the performance and versatility of the Cypher ES for polymer science research and development. One of our most popular configurations is now available as the Cypher ES Polymer Edition with special promotional pricing and availability for fast delivery!
The Cypher ES Polymer Edition includes:
Cypher ES Environmental AFM
⁃ Routinely achieves higher resolution than ordinary AFMs
⁃ Fastest scanning gives results in seconds instead of minutes
blueDrive Photothermal Excitation
⁃ Makes all tapping mode techniques simpler to operate
⁃ Makes imaging more stable, even when changing temperature
⁃ Makes nanomechanical imaging modes more quantitative
High Temperature Sample Heater
⁃ Heats samples at up to 250°C in controlled gas environments
⁃ No-hassle operation without extra controllers, cables, and tubing
Fast Force Mapping Mode
⁃ Captures high-speed force curves for storage modulus mapping
⁃ Captures every curve, including both deflection and Z sensor
⁃ Supports many indentation models, including Hertz, DMT, Sneddon, and JKR
AM-FM Viscoelastic Mapping Mode
⁃ The fastest nanomechanical mapping mode (>20 Hz line rates)
⁃ Quantitatively maps both storage modulus and loss tangent
⁃ Operates over a wide modulus range (~50 kPa – 300 GPa)
Contact Resonance Viscoelastic Mapping Mode
⁃ Quantitatively maps both storage modulus and loss modulus
⁃ Best suited for higher modulus materials (1 GPa – 300 GPa)
GetStarted Automated Image Optimization
⁃ Automatically optimizes imaging parameters before the scan even starts
⁃ Get great data from the first scan line with no tip or sample damage
It may occur that standard instruments are limited in terms of application because of temperature, pressure ranges available, because of the lack of chemical compatibility of some materials against the atmospheres to be tested, or because they cannot achieve very specific functions. Coupling analytical methods can be a way to draw more information from a single sample to understand more into depth its chemical / physical behavior, or to obtain simultaneous data under the exact same conditions. But it requires the evolution of standard analyzers so that they can physically fit and that they are not disturbed by their simultaneous operation.
For such reasons the SETARAM standard thermal analyzers can be customized…
…for specific sample and process conditions
SETSYS Evolution schematics
Thermogravimetry is a common technique for the characterization of the thermal stability of materials, to understand their degradation process or to analyze their composition. Some materials like fluorides or oxyfluorides – which have interesting optical properties – release significant amounts of corrosive gases during their thermal stability testing. To fit to a customer request, our standard SETSYS Evolution TGA was modified in order to stand the release of fluorine and hydrofluoric acid (up to 20% of initial sample mass). A further challenge was that the users wanted to test the material mass uptake under a flow of a gas containing up to 10% in mass of fluorine.
Schematics of the setup after microbalance integration,
reproduced from P. Bazin and al, Dalton Trans., 2010, 39, 8432–8436
A good way to determine the adsorbed species on the surface of a catalyst is infrared spectroscopy, while thermogravimetry is a good tool for the quantification of those adsorbed species. The Laboratory of Catalysis and Spectrochemistry of Caen (France) approached us to modify a standard microbalance in order to fit it with operando IR spectroscopy. The goal was to develop a TG-IR coupling with an IR beam directly oriented to the surface of the catalyst being weighed by the balance.
Metallic alloys are frequently used under high thermal, chemical and mechanical stress. Numerous energy productions applications favor their oxidation, leading to a degradation of their properties. An extreme case is the nuclear power production, where zirconium based alloys are employed in nuclear reactors, at high temperature, under high humidity, and irradiation levels. The aeronautics industry is also concerned by the corrosion phenomena of alloys used in aircraft gas turbines that decrease their service life and/or their efficiency.
Thermogravimetric analysis (TGA) is a well-established experimental method to study the growth of oxide layers on metallic alloys and can be employed to study corrosion processes providing that the thermobalance used:
Is sensitive enough to detect and quantify the mass uptake linked with the growth of a thin oxide layer at the surface of the test specimen
Can accurately and repeatedly simulate severe atmospheric conditions close or identical to those met in real applications (temperature, oxygen level, humidity…)
Has a stable signal over the duration of corrosion tests (up to more than 100 hours)
Is not significantly affected by buoyancy effect linked with atmosphere change during testing, or at least can easily and accurately be corrected by a blank experiment
A typical isothermal TGA data set is depicted in Figure 1, where the resistance to corrosion of an alloy plate was tested at 1100°C. The observed mass uptake (279,5 µg.cm-2) is due to the surface oxidation of the sample. After a fast mass increase, the diffusion of more oxygen through the already formed oxide layer becomes more and more difficult, leading to a deceleration of the oxidation reaction. Several other processes may have an effect on the TGA signal like breakaway, corresponding to mechanically driven rupture in the oxide layer and a subsequent fast increase of the oxidation rate.
Figure 1 – mass uptake vs. time of an alloy plate tested at 1100°C
under a flow of oxygen (30 mL/min) during 100 hours with a SETSYS Evolution TGA
Cyclic oxidation
When testing the resistance to oxidation at high-temperature, the cyclic-oxidation may be preferred to replicate conditions close to the actual conditions of use. Indeed, it integrates isothermal oxidation kinetics, oxide-scale adherence, mechanical stresses, oxide creep and the evolution of these properties with time.
Complex temperature profiles such as the one depicted by the red curve on Figure 2 can be easily programmed. The result is a stepwise mass increase due to the successive oxidation rate increases during heating and decreases during cooling. A chart showing the mass variation per step as a function of the cycle number can then be derived from the mass uptake signal.
Figure 2 – mass uptake vs. time of a steel plate cycled between
500 and 1100°C under a flow of air (30 mL/min) with a TAG symmetrical TGA.
Wet atmosphere
In most cases, humidity promotes corrosion, and experiments under dry conditions may not describe accurately the oxidation processes as they occur in wet atmospheres. This is why it is important to mention that SETARAM thermogravimetric analyzers can be connected to the WETSYS humid gas generator.
WETSYS is designed for any application in which controlling the relative humidity rate of a chamber is necessary. It is a compact and automated wet gas generator based on a simple principle: the mixing of a dry gas and a water-saturated gas so as to maintain the relative humidity of the generated outlet gas at a given temperature.
Both isothermal and cycling temperature profiles can be operated under wet conditions as the TGA temperature control is independent of the WETSYS.
Nb-silicide composites are potentially interesting materials for applications in gas-turbine engines for aircraft, where they may face high-temperature (1150°C) hostile environments (oxygen, water vapor, etc). The team of Michel Vilasi from the Institut Jean Lamour in Nancy, France used their TAG symmetrical thermobalance in order to conduct isothermal oxidation tests at 1100°C under an industrial air flow of 1.5 L.h-1 [1]. The parabolic rate constant that is used in oxidation models could be deduced from these tests.
Temperature cycling, dry conditions
The team of Daniel Monceau, from Institut Carnot CIRIMAT in Toulouse, France, has developed a methodology based on temperature cycles meant to determine the Net Mass Gain, the Gross Mass Gain, the total mass of spalled oxide, the rate of metal consumption and the average oxide scale thickness as a function of the number of cycles.
The instruments involved were a standard TAG symmetrical thermobalance and a home designed 6 samples thermobalance system with a six halogen-lamps-furnace and 6 independent alumina sample holders and 6 balances.
They validated their method on slow and fast oxidation kinetics alloy samples, respectively single-crystal beta-NiAl (168 cycles between 150 and 1150°C) at and P91 steel (13 cycles between at 140 and 800°C) [2].
Later on, a custom designed 5 samples thermobalance developed by SETARAM was adapted to a lamps furnace by CIRIMAT and the same method was also applied other materials like Thermal Barrier Coating [3].
Isothermal, wet conditions
Chromium-bearing steels are used as piping or heat exchanger materials in oxyfuel processes for coal combustion, where they are exposed to hot CO2–H2O gas mixtures. The team of Daniel Monceau, from Institut Carnot CIRIMAT in Toulouse, France, has worked on model Fe–Cr and Fe–Cr–Ni alloys, reacted in Ar–CO2 and Ar–CO2–H2O gas mixtures at 650 °C in a Setsys Evolution TGA equipped with a WETSYS [4]. Oxidation isotherms as long as 300 hours, showing mass uptakes as low as 3mg.cm-2 were collected and showed that during reaction in Ar–CO2 and Ar–CO2–H2O at 650 °C, breakaway occurred via nucleation and growth of Fe-rich oxide nodules.
Figure 5 – Setsys Evolution TGA
Innovating approaches
At the Saint Etienne School of Mines, in the SPIN lab, an innovative setup involving the coupling between a TAG symmetrical thermogravimetric analyzer and acoustic emission was used to study the Zircaloy-4 corrosion mechanism [5].
The system, in which piezoelectric sensors were placed in the balance head and specific wave guides were employed to hold the samples in the TGA furnace, allowed simultaneous measurements of the sample mass variation and AE burst. Combined with post mortem characterization of oxidized samples, it provided additional information on the Zircaloy-4 corrosion mechanism:
Kinetic transition is detected under air oxidation tests at 900°C by a change in the rate of mass gain and by the AE activity
AE allowed distinguishing the cracks which occur during oxidation from the cracks linked with the cooling of the samples
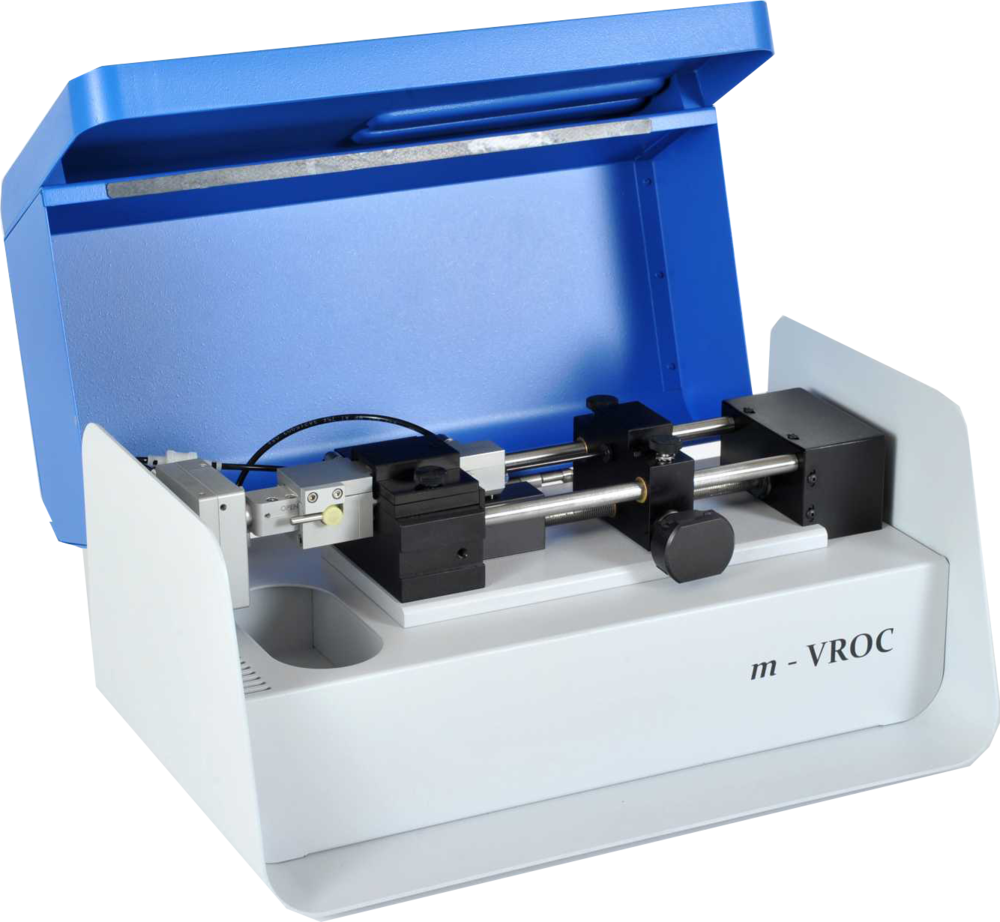
Viscosity of inkjet inks with m-VROC® and microVISC™:
Digital printing technology has motivated a rapid growth of the inks industry. The increasing demand for inkjet inks has resulted in faster production and more stringent quality control requirements. To meet the market demands, efficient, fast, and highly accurate and fast characterization methods are required.
Two main physical properties determine print quality – surface tension and viscosity. These two factors play a key role in droplet formation as well as the uniformity of the resulting printout. Ink viscosity depends on the ink formulation (pigments, resins, binders…), temperature, and in some cases, the shear rate specific of the inkjetting process.
At the same time, inks often present low viscosity values (<10 cP). This results in flow instabilities when trying to achieve high shear rate measurements of viscosity with conventional rheometers and viscometers.
VROC® powered instruments, m-VROC® and microVISC™, provide a solution to the challenges of conventional viscometer technologies. By utilizing the combination of a capillary and MEMS device, VROC®’s superior technology enables fast and accurate characterization of inkjet inks, ceramic inks, water based inks and biopolymer based inks. The high accuracy and repeatability over a wide range of shear rates make our systems Simply Precise™ with ease!
Target Keywords
Inks Viscosity
Inkjet Inks
Non-Newtonian Inks
Shear Thinning Inks
Accurate Low Viscosity Measurements
Viscosity Fingerprinting
Industries:
Inkjet Inks
Ceramic Inks
Water Based Inks
Biopolymer and Protein Inkjet
Formulations
Current Customers
Hewlett PackardHewlett-Packard Company (HP) is a global company headquartered in Palo Alto, California, United States. It is one of the first developers and leading manufacturers of inkjet printers since the late 1970s.
Viscosity is one of the key factors determining the quality of inks. Utilizing m-VROC at various locations, researchers study the rheological behaviors of inks during jetting.
FerroHeadquartered in Cleveland, Ohio, Ferro operates in 26 countries globally.
One of Ferros’s innovative product lines focus on inks for digital print decorations for ceramic tiles. With the help of m-VROC, Ferro is able to build the fluid profile for their samples and correlate viscosity with different formulation parameters.
Potential Customer
INX International Ink Co.
A part of Sakata INX, a $1.3 billion company, INX International has 15 plants in the U.S. and Canada along with more than 50 locations worldwide.
Among North America’s top three ink providers, only INX focuses on print formluations, starting from developing the chemical and into the finished product.
The aim of this webinar is to highlight the benefits of correlative microscopy for studies of graphene and related two-dimensional transition metal dichalogenides (TMDs) such as MoS2 and WS2. Raman Imaging is used to characterize the optoelectronic properties of 2D materials. In combination with AFM and SEM the precise geometric dimensions of these materials is determined. Photonic properties can be gained using SNOM.
Key learning objectives are:
Gain insight as to how unrivalled spectral and spatial resolution, ultra-fast acquisition times, and exceptional signal sensitivity in Raman Imaging can be combined with AFM, SNOM and SEM.
Learn which properties of low dimensional materials can be characterized with Raman and how complementary techniques lead to a more comprehensive understanding of the sample.
Learn how to configure a Raman microscope in order to perform high-sensitivity and high-resolution 3D spectral imaging routinely.
This webinar will introduce RheoSense’s automatic, high throughput viscometer, VROC® initium. Attendees will get the first sneak peek of the instrument and data.
Monitoring oil viscosity as a function of temperature and shear rate is essential for many reasons including:
– Ensuring Oil Quality
– Oil Characterization Under Different Conditions
– Detecting Oxidation (Decay)
– Improving performance of engines & preventing mechanical failure
– Reducing wear, inhibiting corrosion, improving sealing and cooling
This webinar will cover the analysis and characterization of oils across temperature and shear rate ranges, along with the importance of such characterization. In addition, it will cover the estimation of high-temperature viscosity values utilizing room-temperature viscosity measurement and ASTM D341.
Application Corner is an outlet to help specify target markets and provide guidance to exploring applications and potential customers. Application information, target keywords related to the application, and customers will be provided.
Viscosity Fingerprint of Conductive Inks with m-VROC:
Printed electronics, touch screens, optoelectronics and PV devices are just some application examples for conductive inks. To enhance electric conductivity these fluids often contain silver, copper or carbon-like materials. The rheological properties of these formulations are determined by the size, shape, concentration, and structures formed by the conductive materials.
The viscosity fingerprint (i.e. viscosity dependence on shear rate) of these conductive fluids will determine performance and flow during manufacturing processes. Conventional methods to measure viscosity often suffer from flow instabilities at high shear rates, which can result in erroneous estimates of viscosity at the shear rates that are relevant for inkjet (104-5 1/s) and roll coating (104) processes.
m-VROC™ viscometer has the widest dynamic range for the measurement of viscosity. The high accuracy, high shear rate capabilities, and high speed of measurement make our systems Simply Precise™
Electroninks
Electroninks Incorporated is a printed electronics company based on high-performance, low-cost printed electronics via novel materials development. Currently, the company offers two product lines; Circuit Scribe, a rollerball conductive pen for the STEM education and maker communities and Reactive Silver Inks, novel silver inks for the printed electronics industry that achieve conductivities of up to 90% of bulk silver with annealing temperatures under 100C.
Potential Customers
C3nano
C3nano is the developer of the solution-based, transparent conductive inks and films as direct replacements for indium tin oxide (ITO). C3nano’s advancements in silver nanowire (AgNW) based technology enable 30 to 50 Ohms per square for a new generation of smart flexible devices with enhanced sensing functions.
Cambrios Technologies
Cambrios is the leader in silver nanowire solutions to enable the development of electronic devices with transparent conductors. Our proprietary nanostructured materials can be deposited using existing production equipment to achieve enhanced performance of display devices and components at lower manufacturing cost.
ClearOhm®, their first product, is a directly patternable, wet-processable transparent conductive film made from silver nanowires that is poised to replace the industry standard sputtered indium tin oxide (ITO). Subsequent products will leverage this technology to produce other functional films for display and thin film applications for multiple consumer electronic device markets.
You’re being told it won’t work? Let’s find a solution together!
Some applications require very specific laboratory organization in order to deal with hazardous materials, special sample conditioning or pre-treatment. If your laboratory is equipped to meet all those requirements, your instrumentation must be customized to become compatible with these specific operating conditions. SETARAM skills in instrument design, our expertise in sensors, electronics, thermal transfers, materials and the organization of our R&D optimized for developing customized solution can help at tackling any type of challenging condition.
Protection of the user against the sample: the case of radioactive materials research
Radioactive materials science requires handling of hazardous substances (fuels, wastes, reactive gases, etc) under safe conditions for the operators and characterization instruments. In a lot of cases, these materials need to be handled in glove boxes or in hot cells (lead chamber) depending on the radiations types and intensities.
Thermal analysis and calorimetry are common thermal characterization techniques for nuclear fuels (current or candidates), wastes, and surrounding materials (ex: cladding). It means that the instruments concerned must be customized to become compatible with these specific operating conditions.
An extreme adaptation case: the space calorimeter
Among the most challenging laboratory conditions are those of the International Space Station (ISS)…
Calorimetry is a common technique for the characterization of water-in-oil emulsions that can be met in the petroleum or food industry fields. A phenomenon affecting the stability of emulsions is known as coalescence, which refers to the merging of small water droplets into larger ones. Gravity being one of the driver for coalescence, researchers from the European Space Agency initiated the FASES project (Fundamental and Applied Studies on Emulsion Stability) to study the impact of the absence of gravity on emulsion stability. They consulted SETARAM Instrumentation to develop a calorimeter able to fit with the challenging conditions of a laboratory in space.


 to provide highest spectral performance. Red: beta-Carotene- rich areas, Green: Starch, Blue: Water")
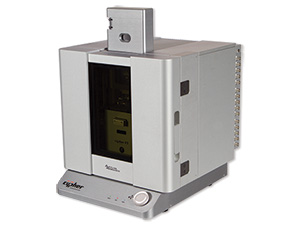
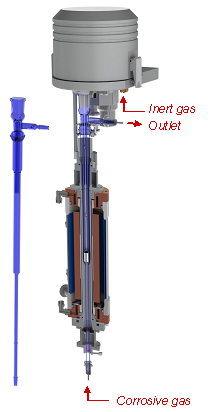
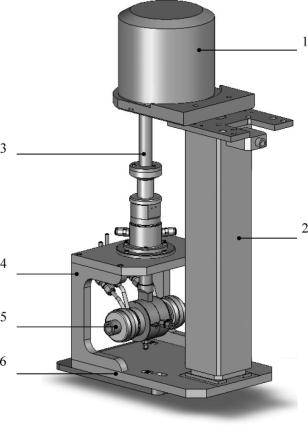
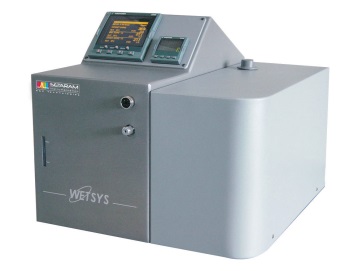
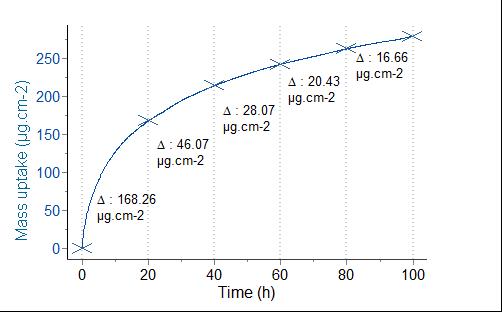
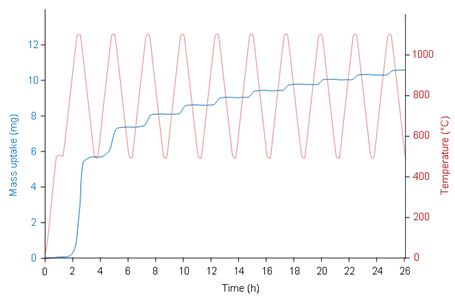
 Figure 3 –
 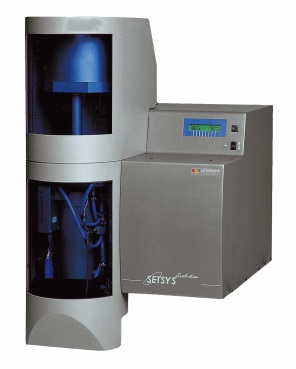 Figure 5 – Setsys Evolution TGA